
Many companies enjoy the efficiencies that ERP brings to the business after it is implemented.
Through unified inventory database, users can manage and share transaction records that have otherwise been managed within different departments in the past. By sharing company-wide information, inefficiencies such as double entry of data are reduced, if not eliminated.
While such conveniences of an ERP can sometimes lead to misconceptions by users, thinking that all the information can be retrieved by just implementing the system. We’d like to sort out what type of data in particular can be acquired in reality.
In this article, we’ll explore how you can fully utilize the large volume of accumulated data.
Is BI (Business Intelligence) necessary?
While most ERPs come with a set of general functions that are widely used by corporate management, the standard set of reports available out of the box are usually limited to accounting, such as balance material for accounts receivable and accounts payable, trial balance, inventory evaluation report and templates for invoices and purchasing slips.
As a result, there are surprisingly many cases where the standard reports are not enough to cover all the company’s needs, and the person in charge can end up aggregating data from each ERP module, creating a performance analysis report on spreadsheets like Excel.
In such cases, the speed and accuracy of obtaining real time data becomes critical for the user to make decisions in time, and will likely be under constant pressure. It is not an exaggeration to say that a detailed document can sometimes take a whole day to create.
Various data analysis tools (BI tools) exist to help reduce such burden involved in creating analysis materials that require handling of real-time, accurate data.
We’ll explore two such tools. These tools can be directly integrated to the database of Dynamics 365 Business Central and used for a wide range of data analysis activities.
Examples of analytical reporting tools for Dynamics 365:
Jet Reports
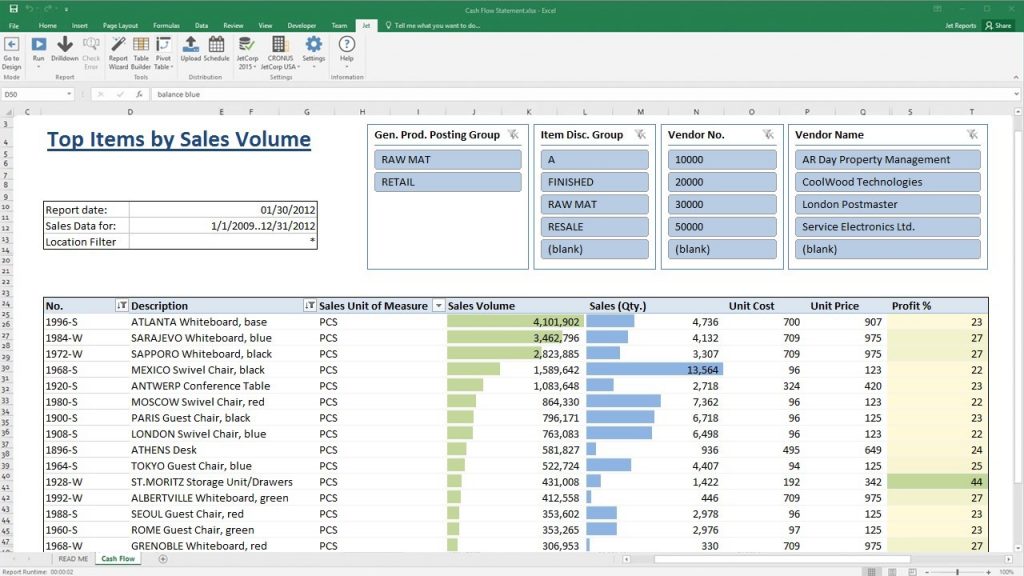
Jet Reports is an Excel-based reporting tool that allow users to browse the Dynamics ERP database directly and does not require complex programming to create reports.
Since the destination of data output is Excel, it is possible to perform analysis using the standard Excel functions such as report layout, graph insertion, filter function, and time axis analysis.
It is mainly used for the following purposes:
- Revenue analysis by item
- Revenue analysis by business location or department
- Sales transition analysis by salesperson
- Profit and loss statement by business location or department
- Detailed inventory management chart
It also has the following characteristic functions.
- Drill down from Excel (Jet Reports) to the ERP source data
- Reporting of data from multiple integrated ERP tables
- Set a schedule job to automatically send specific report to multiple people
- Centralized management of created reports in a web portal (Jet Hub)
Power BI
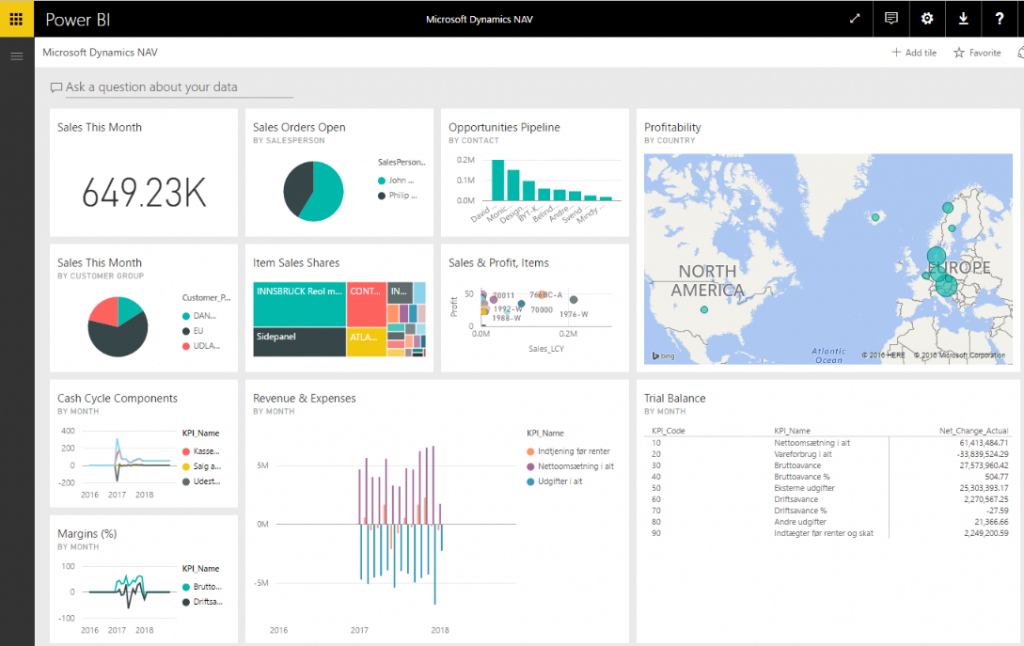
Next, we will explore a dashboard tool.
Dashboard is like an overview of instruments in the cockpit of an airplane, as it displays key business indicators using visual objects that are very easy to see. Unlike detailed data lists using spreadsheets, it is suited for intuitive data analysis like finding data trends and outliers at a glance.
Power BI is a dashboard creation software provided by Microsoft, and has a mechanism that allows you to refer to data from various software.
It is ready to be integrated with ERPs like Dynamics 365 Business Central, and it doesn’t require any advanced programming either, so we highly recommend utilizing this tool.
For example, it can be used for reports like the following:
- Sales trend by item
- Sales by region
- Revenue ranking by item
- Sales ranking by customer
- Preliminary sales and earnings figures for the current month
- Trends in sales projects
- Cash flow trends
- Revenue trends by location or department
- Sales change by sales staff
It also has the following characteristic functions:
- Users viewing the data can easily change the axis of analysis according to preference.
- Can be used from data analysis too forecasting
- Enables layout design optimized for smartphones and tablets
- Share dashboards between Power BI users
- Schedule and email your dashboard regularly
- Integration with Office 365 (sharing within Teams and email)
- Dashboard view within Dynamics 365 Business Central
Finally, here are some points to be mindful when using such tools.
Analysis Axis of Data
When analyzing data with BI tools as described above, it is important to consider whether the data analysis axis is defined in the ERP.
For instance, preparing to make business site code and department code as requirements for the analysis axis of each transaction information would be such example.
It is necessary to envision a design for your report or dashboard that you want to output, and structure the ERP accordingly with such analysis axis.
In Dynamics 365 Business Central, the ERP offers multiple analysis axes called Dimension that can be defined.
Accuracy of Data
Also, while it is possible to set the data analysis axis in the ERP system, it is necessary to record it properly as data in operation. If the data is not input properly, the output will also naturally end up being inaccurate. Since it is possible to automatically enter the default analysis axis in the ERP according to the scenario of each transaction, it is important to record data reliably while utilizing such means.
Dashboard Design
Lastly, although this is about looks, it is important to design the layout of reports and dashboards as simple and purposeful as possible.
As dashboard is particularly a tool that takes advantage of the ability to obtain necessary information at a glance, if you see too many objects or a mixture of irrelevant graphs, it ends up defeating the purpose.
Since Dynamics 365 Business Central comes with a standard set of dashboards, we recommended utilizing them, and adding your own configuration only as necessary.
At Calsoft Systems, we propose solutions that improve business operations by combining ERP products such as Dynamics 365 Business Central and Business Intelligence (BI) products as mentioned above.
If you implemented an ERP, but still feel there are inefficiencies such as taking too much time to create data analysis materials, we highly recommend considering such methods.
